
Categories insights
PremiumSpending insights tells you who you spent with. This report tells you what on.
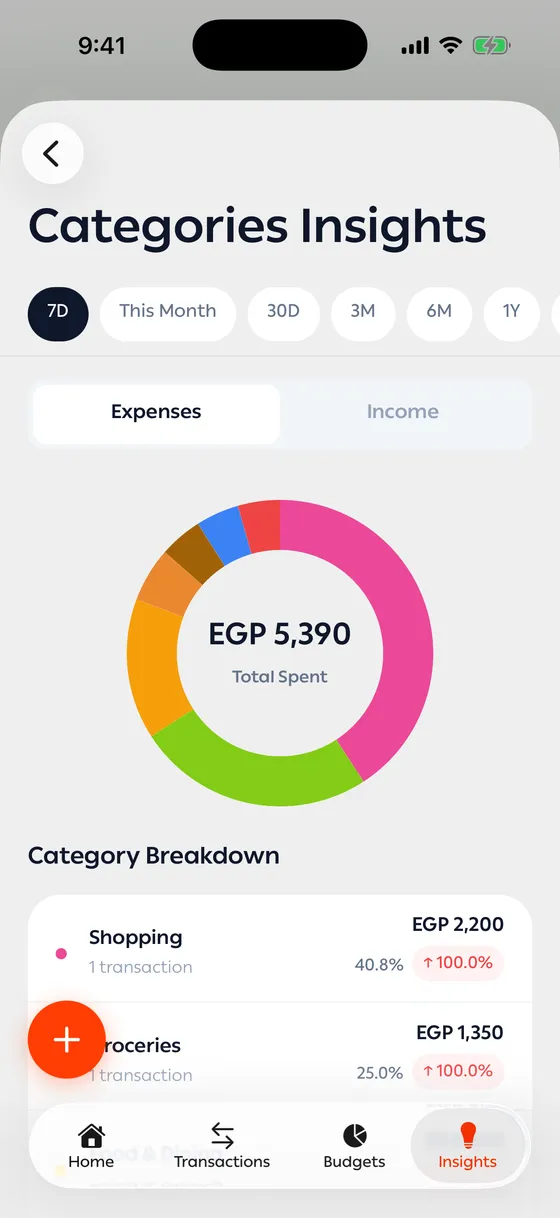
What you see
Section titled “What you see”- A donut chart splitting the period’s spending across categories.
- Category breakdown — each category with its amount and its share of the total.
- Other categories — the small ones grouped into a single line so the chart stays readable.
Every category is compared against the previous period, like the other reports.
Your own categories count
Section titled “Your own categories count”Categories you made yourself appear here like any other, in the colour and icon you chose. See Categories.
- If one category takes more than half the chart, that’s where saving starts.
- Tap any slice to see its transactions.
Common problems
Section titled “Common problems”“Other” is large — some transactions have no category. Open them and set one, or use Bulk edit.
The same place keeps landing in the wrong category — give it a rule once and it’s done.