
Spending insights
PremiumThis report answers one question: how much did I spend, and where did it go?
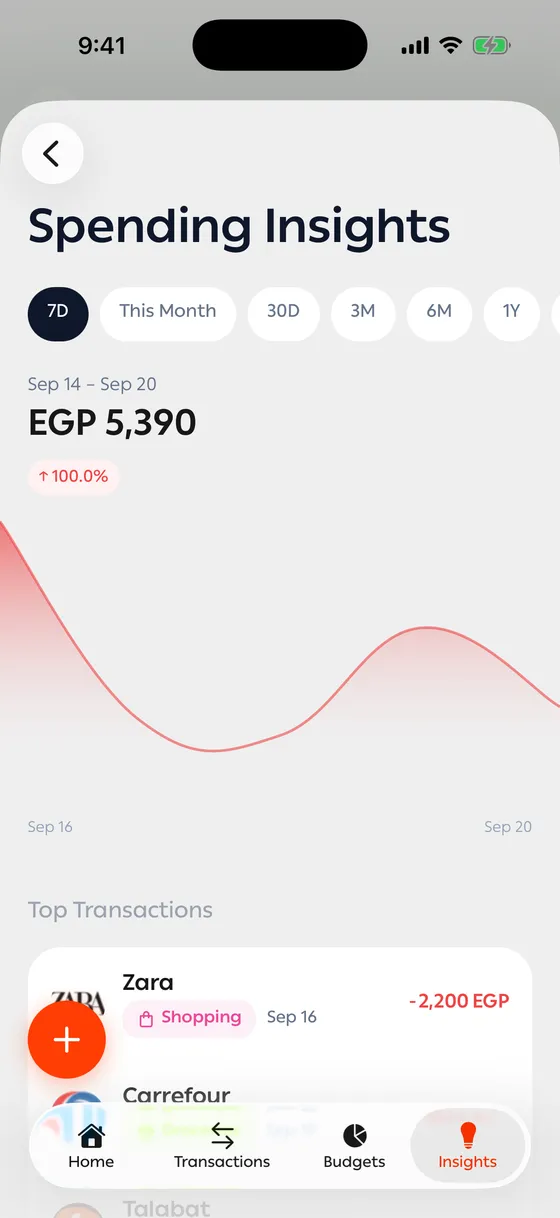
What you see
Section titled “What you see”- Total spent for the period, with a comparison against the previous period — an arrow up or down and a percentage.
- Spending trends — a chart across the period, so the days that spiked stand out.
- Top transactions — the largest amounts that left you.
- Top merchants by spend — who took the most from you.
- Most frequent merchants — where you go most often, even when each visit is small.
The comparison
Section titled “The comparison”Pick 30D and you’re compared against the 30 days before that. Green means you spent less; red means more.
Getting to the transactions
Section titled “Getting to the transactions”Tap any merchant or any bar in the chart to see the transactions behind it.
- Read the monthly view first, then drop to 7D if an odd number catches your eye.
- Use Custom to compare the same month against last year, if you want the real change.
Common problems
Section titled “Common problems”One place shows up under two names — the transactions were read with two different spellings. Merge them with a rule from Merchant rules.
A strangely large number — usually a transfer recorded as an expense. Fix it in Transfers.